3D ex vivo imaging and characterization of cell death
Your Needs:
Our Solutions:
- Study of cell death in any organ
- Preclinical study of treatment efficacy
Our Solutions:
- Light sheet microscopy after clearing of ex vivo samples
- Automated 3D image processing to count necrotic cells in organs
General Procedure
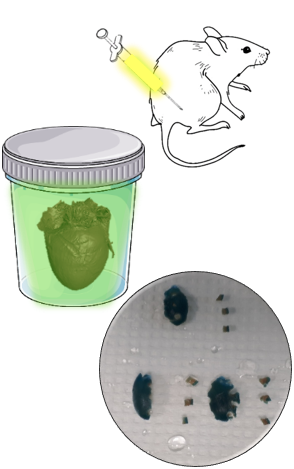
Prior to sample collection by Imactiv-3D:
- In vivo animal perfusion to label necrotic nuclei (PI)
- Formalin fixation of extracted sample
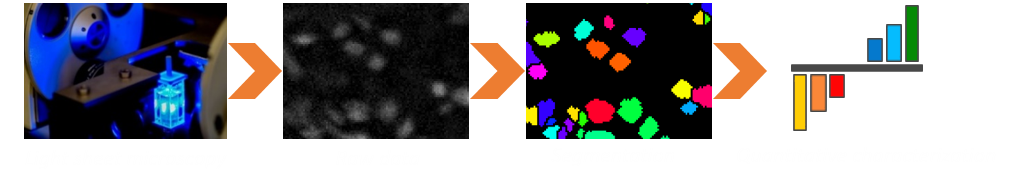
Image acquisition:
- Staining of ex vivo samples with nuclear dye to label all cells (DRAQ5)
- Biopsies of 2.5-mm-diameter regions of interest
- Clearing of samples and 3D light sheet microscopy
Image processing and joint analysis of both fluorescence channels:
- 3D image restoration based on denoising and pre-segmentation
- 3D refined segmentation and quantification
- Quantitative analysis of necrosis rate as the ratio: number of necrotic (PI) nuclei⁄total number (DRAQ5) of nuclei
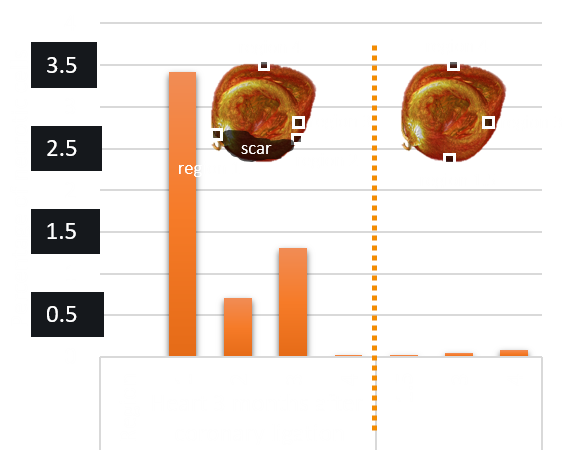
Application example: Quantification of necrosis after myocardial infarction

- Definition of regions of interest depending on their distance to the infarct scar. In this study, 21 regions were explored (triplicate in each region).
- Analysis of necrotic nuclei percentage in healthy and post-infarct rat hearts.
- Regions near the scar showed much more necrotic cells (regions 1 to 3) than the control region (region 4) and than all regions in the healthy heart.